GBP/USD: Why Is the Pound Still Struggling Despite Hawkish BoE Expectations?


The Bank of England is maintaining a hawkish stance as inflation pressures persist. Meanwhile, signs of a cooling US labour market are raising questions about the Federal Reserve’s next move.
Both developments could offer support to the British Pound. So why is GBP/USD still struggling to recover?
The answer lies in a complicated mix of monetary policy expectations, economic pressures and technical resistance.
With GBP/USD trading near 1.3216, the pair is showing early signs of stabilisation, but a sustained recovery remains uncertain.
UK Inflation: Support for Sterling Comes at a Cost
UK inflation continues to challenge the Bank of England’s efforts to bring price growth back towards its 2% target.
Annual CPI inflation rose from 2.9% to 3.1% in August, with elevated energy costs adding further pressure.
Bank of England Monetary Policy Committee member Catherine Mann has warned that above-target inflation is becoming increasingly persistent. She has also expressed concern that year-end wage negotiations could reinforce the relationship between wage growth and consumer prices.
Mann has consistently supported raising interest rates by 25 basis points to 4% since July, reflecting her relatively hawkish position.
In September, the Bank of England voted 6–3 to maintain its benchmark interest rate at 3.75%, while market expectations for a potential November rate increase remained elevated.
Ordinarily, expectations of higher interest rates can strengthen a currency by improving its relative yield appeal.
But the same inflation pressures supporting expectations of tighter monetary policy are also weighing on the UK economy.
Higher energy costs reduce households’ purchasing power and squeeze corporate profit margins. If those pressures weaken consumption and business activity, the potential benefits of higher interest rates for Sterling may be limited.
The next important test will come from wage growth, consumer spending and the upcoming UK inflation release on 21 October.
US Economy: Weaker Employment, Persistent Inflation
Across the Atlantic, the Federal Reserve faces a different but equally difficult policy environment.
September US nonfarm payrolls increased by just 29,000, while unemployment rose to 4.2%. Average hourly earnings grew by 3.0% year-on-year, pointing to further moderation in labour market conditions.
However, inflation remains a concern.
August US CPI stood at 3.4% year-on-year, suggesting that price pressures have yet to return to comfortable levels.
Following a 25-basis-point rate increase in September, the federal funds target range reached 3.75%–4.00%.
Interest rate futures indicate that markets are leaning towards a pause in October, although expectations of further tightening later in the year have not disappeared.
This creates a difficult balancing act for the Fed.
Employment data suggests the economy may need support. Inflation data suggests monetary policy may need to remain restrictive.
For GBP/USD, the implications are significant.
If inflation pressures strengthen again, particularly through higher energy costs feeding into consumer prices, the US Dollar could retain support from its interest rate advantage.
Conversely, if employment continues to weaken while inflation gradually cools, the case for further tightening may diminish, potentially limiting the Dollar’s upside.
The direction of GBP/USD will therefore depend not simply on which central bank appears more hawkish, but on how expectations for their respective policy paths evolve.
GBP/USD Technical Outlook: Stabilisation Is Not Yet a Reversal
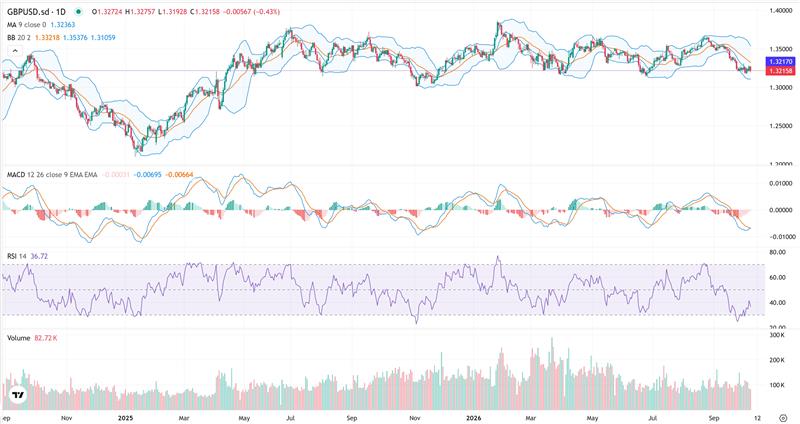
Despite the potential fundamental support for Sterling, the daily technical picture remains cautious.
GBP/USD has retreated from above 1.3600, moving towards the lower Bollinger Band before showing signs of stabilisation around the 1.3200 area.
At approximately 1.3216, the pair remains below its 9-day moving average at 1.3236.
The middle Bollinger Band, currently near 1.3322, represents another important overhead barrier.
These levels suggest that buyers have yet to establish sufficient momentum to reverse the broader downward trend.
Key Levels to Watch
| Level | Technical Significance |
| 1.3320–1.3322 | Higher resistance; a sustained break could signal improving recovery momentum |
| 1.3235–1.3250 | Immediate resistance and first test of buying strength |
| 1.3216 | Reference price at the time of analysis |
| 1.3105–1.3150 | Key downside support zone |
| 1.3106 | Approximate lower Bollinger Band |
The immediate question is whether GBP/USD can reclaim 1.3235–1.3250.
Failure to move convincingly above this area could leave the pair vulnerable to another test of the 1.3105–1.3150 support zone.
A sustained break above 1.3320, however, would suggest that the recent downward pressure is beginning to ease, opening the possibility of a broader technical recovery.
Momentum Indicators: Selling Pressure Is Easing, but Buyers Remain Cautious
Momentum indicators reinforce the view that GBP/USD is stabilising rather than entering a confirmed bullish reversal.
MACD: Bearish momentum remains in place
The MACD remains below the zero line, with its signal lines maintaining a bearish configuration.
Although the lines are beginning to flatten at lower levels, suggesting that downward momentum may be losing intensity, there is not yet a convincing indication of renewed bullish strength.
RSI: Recovering from near-oversold conditions
The 14-day Relative Strength Index stands near 36.8, having recovered from levels approaching oversold territory.
This improvement suggests that selling pressure may be easing.
However, with RSI still below the neutral 50 level, buying momentum remains relatively weak.
Bollinger Bands: Early signs of support
GBP/USD has rebounded after approaching the lower Bollinger Band near 1.3106, indicating some buying interest at lower prices.
Nevertheless, a rebound from the lower band does not necessarily signal a trend reversal.
Taken together, these indicators point towards a period of weak consolidation rather than a confirmed recovery.
Outlook: Can Monetary Policy Support Overcome Technical Weakness?
GBP/USD is currently caught between two competing forces.
On the fundamental side, persistent UK inflation and expectations of further Bank of England tightening may help limit Sterling’s downside.
At the same time, the Federal Reserve’s response to weaker employment and persistent inflation will influence whether the US Dollar can maintain its interest rate advantage.
On the technical side, however, GBP/USD remains under pressure, with moving averages and momentum indicators yet to confirm a meaningful reversal.
Three price areas deserve particular attention:
- 3235–1.3250: Can buyers overcome the first major resistance zone?
- 3105–1.3150: Will support hold if selling pressure returns?
- 3320: Could a sustained breakout signal a more convincing recovery?
Until GBP/USD can establish itself above the higher resistance area, the broader technical outlook remains cautious.
The key question is no longer simply whether the Bank of England will remain hawkish. It is whether that policy support will be strong enough to overcome the Pound’s persistent technical weakness.
That is the tension likely to shape GBP/USD’s next move.
Disclaimer: This material is provided for general information only and does not constitute investment advice. Past performance is not indicative of future results. Trading financial products involves risk.